DEPARTMENT OF AIRPORTS · OPERATIONS AI
AI FOR AIRPORTS
Two systems on the board: a passenger-throughput forecaster and a retrieval-augmented security assistant — each answering with evidence, not guesses.
What this delivers
Two AI systems for a single hub (modelled at Atlanta / ATL scale). Each one turns a prediction into a decision an operations team can act on — the demos below show the same outputs live.
See demand before it arrives
Forecast daily passenger throughput so rosters, gates and concessions are sized to real demand — not over-staffed, not caught short.
see it below →Shorter queues, leaner shiftsStaff the rush, not the clock
Turn the forecast into an hour-by-hour lane plan: open lanes before each bank and pull them back in the lull, holding waits near target.
see it below →Cited · grounded · any languageAnswers you can trust
A retrieval bot that cites its sources, replies in the asker's language, and says “I don't know” instead of inventing a confident wrong answer.
see it below →Usage forecasting
Predicts daily passenger throughput. A seasonal baseline and a LightGBM model are backtested, and whichever wins is served. The dotted line is the flight-schedule leading indicator— passengers ≈ scheduled seats × historical load factor — the signal real airport (ACI) forecasts lean on because it's known weeks ahead.
Predicted daily passengers — next 14 days
Demo data — Atlanta (ATL) scale (~148k pax/day), modelled from the public TSA national throughput pattern. Real per-airport feeds slot in later.
- 01Data
Public TSA publishes one number a day — the US national checkpoint total (e.g. 2,988,204). We scale it to a single hub: × 6%≈ Atlanta's share → ~148k departing pax/day. Real TSA pattern, ATL size.
- 02Model
A tree can't extrapolate a trend, so LightGBM predicts a multiplierover the last 7 days' average, learned from the calendar (day-of-week, holidays, season) + recent lags: forecast = 7-day avg × calendar factor. The dashed line is a second model reading the future schedule: seats × load factor.
- 03Worked example
A Friday runs ~1.10× a normal day, so 150,000 × 1.10 ≈ 165,000. Each predicted day feeds the next day's average (recursive).
- 04Proof
All three models are back-tested on history they never saw; the lowest-error one is served (~3% average error). The chart shows two lines: the amber champion and the dashedschedule signal. The third — a seasonal-naive baseline — is just the yardstick (3.34% vs 3.05% error), so it's a number, not a line.
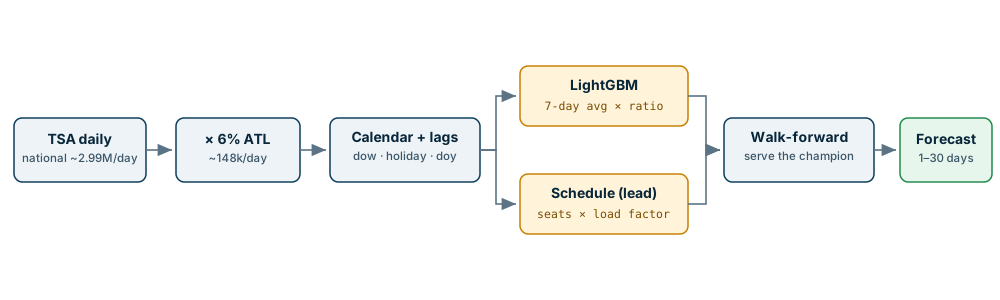
Staffing, gate allocation and retail orders all key off how many passengers show up. Guess high and you burn payroll; guess low and queues blow out. A reliable 1–4 week outlook is the input every other plan depends on.
The amber lineis the served model's day-by-day forecast. The dashed line is the schedule-led estimate (seats × load factor), known weeks ahead. When they agree, confidence is high; where they split is a day worth a second look.
Lock rosters and concession orders to the forecast ~2 weeks out, and pre-empt the busiest days (Thu/Fri/Sun here) instead of reacting to them.
Checkpoint wait-time & staffing
This is the security screening checkpoint — the screening you clear after check-in / bag-drop and before your gate. The daily forecast becomes an operational plan: how many passengers reach screening each hour, how many lanes to open, and the queue wait if you don't staff to the peak. Opening lanes ahead of the bank — instead of reacting to a queue — is the lever on both wait times and staffing cost (the approach behind TSA / Veovo / Xovis systems).
Hourly demand vs. wait — flat vs. demand-matched staffing (busiest forecast day)
Illustrative synthetic intraday model — real systems use sensor counts + ML.
- 01Data
Start from the day's forecast total and spread it across the clock with a typical arrival profile — a morning bank and an afternoon bank, near- zero overnight — to get passengers reaching screening each hour.
- 02Lanes
A modern lane screens ~250 pax/hour, so lanes to clear an hour = ceil(arrivals / 250).
- 03Wait curve
Wait keys off utilisation u = arrivals ÷ capacity: negligible while lanes have slack, then it climbs and spikes once demand outpaces open lanes (u<1 → (u−0.6)×50; u≥1 → 30+(u−1)×120), capped at 90 min.
- 04Worked example
A peak hour bringing ~11,000 pax needs ceil(11,000 / 250) = 44 lanes. Open only 36 and u ≈ 1.22 → a ~56-min queue; open the 44 and the wait stays low — that gap is the two lines on the chart.
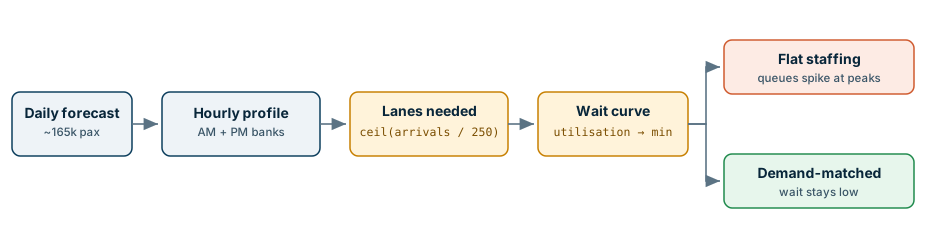
The same passengers can mean a 5-minute wait or a 45-minute one — the difference is whether lanes were open before the rush. Under-staff and queues spike; over-staff all day and you pay for idle lanes.
Bars are passengers arriving each hour. The orange line is the wait under flat staffing — it spikes at the morning and afternoon banks. The green line is the wait when lanes track demand: it stays flat and low. The gap between them is the queue smart staffing removes.
Roster lanes to the “lanes needed” curve — ramp up before each bank, pull staff back during the midday lull — to hold the wait near target.
Security assistant
A retrieval-augmented chatbot for airport-security questions. It answers from a document index and cites sources — and refuses when the answer is not grounded, instead of guessing (try the last one below). It also detects the question's language and replies in it — Thai, Chinese, Japanese, Arabic and more (try the non-English examples). Sample answers shown when the API is offline.
For staff & analysts — the same assistant also answers questions about the operations data: incidents (what happened, where, how severe) and door access logs. It turns plain language into read-only SQL, runs it, and shows you the query — and refuses anything that would write to the database.
- 01Index
Approved docs are split into chunks and turned into embeddings (number vectors capturing meaning), stored in pgvector on Postgres — done once, offline.
- 02Retrieve
Your question is embedded the same way; pgvector returns the top-k chunks by cosine similarity — the passages closest in meaning, not just keyword matches.
- 03Answer
The LLM answers from those retrieved passages and cites them. If nothing relevant comes back, it refuses rather than guess — that's the grounded guardrail.
- 04Analyst path
For data questions it writes read-only SQLover the incidents / access-log tables — writes and DDL (e.g. “drop the table”) are blocked.
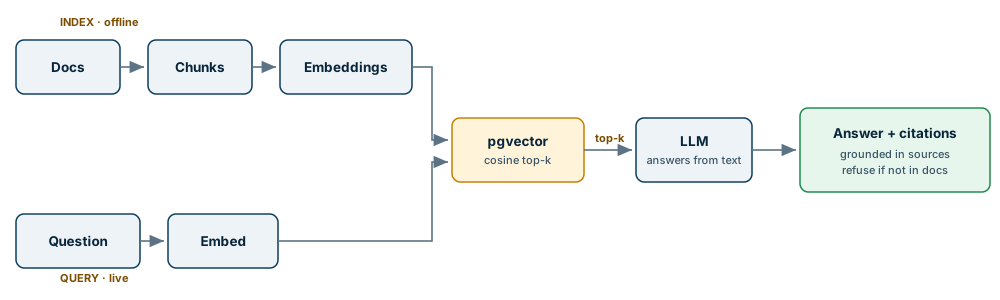
A wrong security answer is a compliance and safety risk. Off-the-shelf chatbots invent plausible-sounding rules; this one answers only from approved documents and declines when it isn't sure.
● grounded plus a citation means the answer is traceable to a source. ○ not grounded means it refused rather than guess. The language tag shows it replied in the asker's language (try the Thai example).
Point passengers, front-line staff and analysts at the same bot — self-serve FAQs, cited SOPs, and incident look-ups — without the risk of made-up guidance.
About the system
usage-forecasting
FastAPI service forecasting passenger throughput — a seasonal baseline, LightGBM on calendar + lag features, and a flight-schedule leading indicator, backtested so the winner serves. Adds a `/wait` plan for hourly lanes & queue times. Modelled at Atlanta (ATL) scale from public TSA throughput; real per-airport data later.
security-assistant
RAG over a document index + structured DB. Cites sources, refuses when not grounded, and answers in the passenger's language. Provider-agnostic LLM: local Ollama for dev, Claude on AWS Bedrock for production.